Markets on Edge: Record Valuations Meet Fed Rate Cut

The U.S. stock market is at a crossroads. The S&P 500 is now trading at 3.15× sales, its highest valuation in history — even higher than the dot-com peak in 2000 and the AI-driven surge of 2021. At the same time, the Federal Reserve is preparing for one of its most important policy meetings of the year on September 16–17, 2025.

The stakes couldn’t be higher. Here’s what you need to know — in plain English.


Why Valuations Matter

  • The long-term average Price-to-Sales ratio for the S&P 500 is around 1.5–2.0×.
  • At 3.15× sales, investors are paying more than ever for every dollar of revenue.
  • Historically, when valuations run this high, future 10-year returns shrink and the market becomes more fragile.

In short: the market isn’t guaranteed to crash tomorrow, but the odds of lower long-term returns (and sharper corrections) increase significantly.


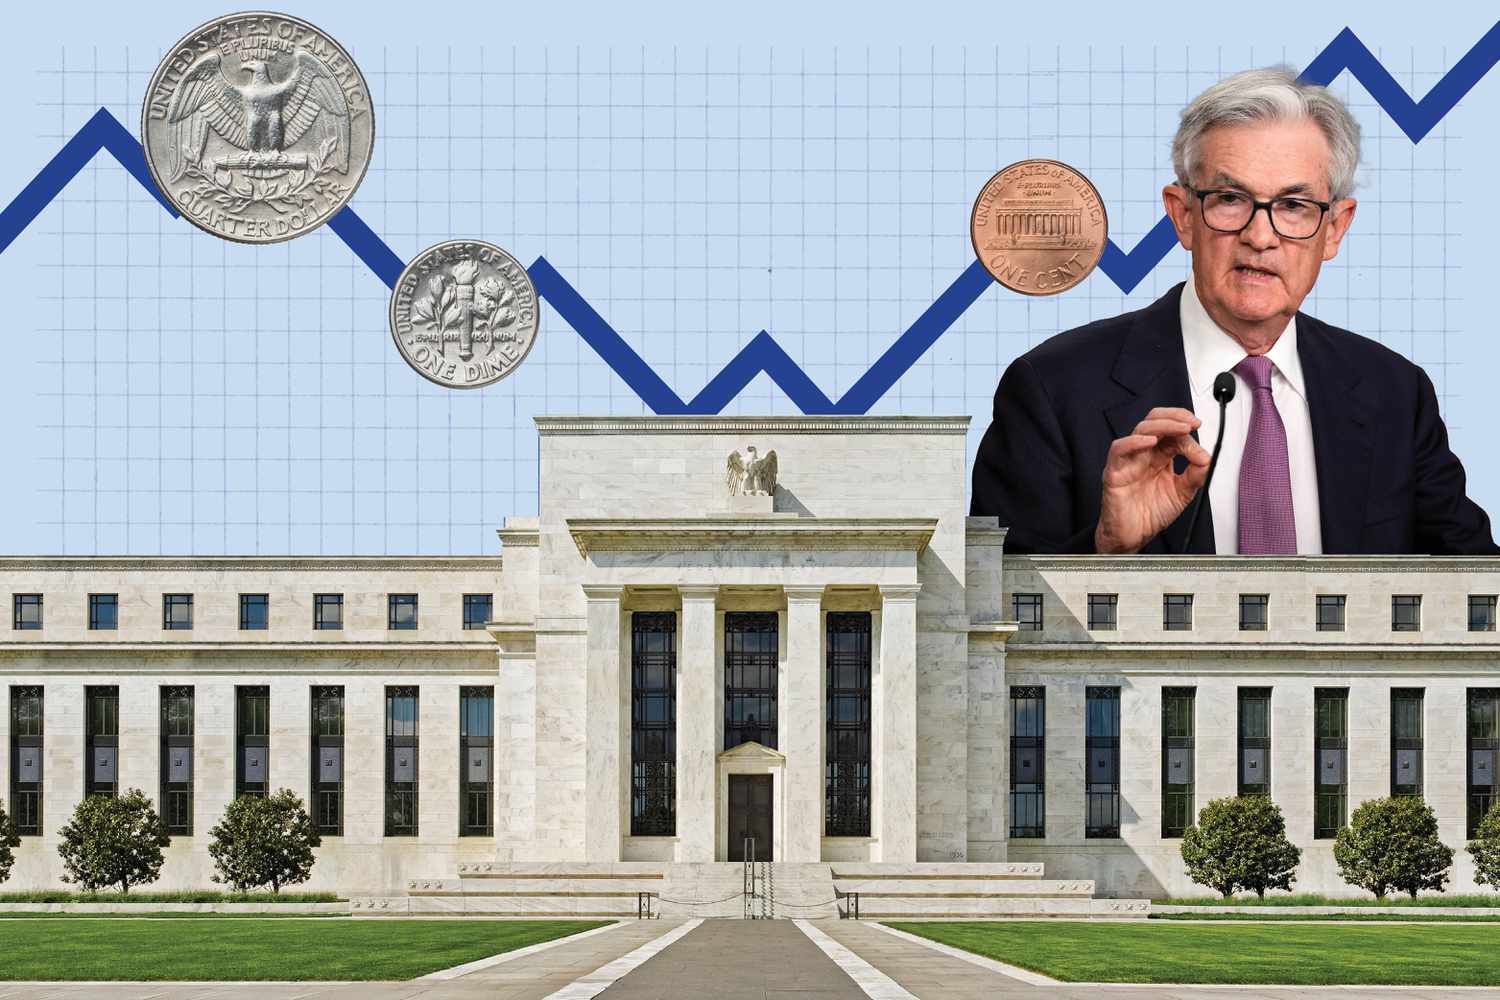
All Eyes on the Federal Reserve – September 17

The Fed’s upcoming meeting is critical because it comes amid slowing economic growth and sticky inflation.

  • What’s expected: Markets overwhelmingly expect a 25 bps rate cut, with a smaller chance of a surprise 50 bps cut.
  • Why now:
    • August jobs report showed just 22,000 jobs added.
    • Unemployment ticked up to 4.3%.
    • Earlier payrolls were revised lower by over 900,000 jobs.
  • The challenge: Inflation is still running close to 3%, above the Fed’s 2% target. Policymakers face a balancing act between supporting a weakening job market and keeping inflation in check.

TL;DR — Market Setup for September

  • Valuations: S&P 500 at record highs (3.15× sales).
  • Fed Meeting: Rate cut almost certain; size (25 vs. 50 bps) is key.
  • Market Fragility: Expensive equities vulnerable to disappointments; risk of “sell the news” reaction.
  • Gold: Approaching record highs as investors hedge against uncertainty.
  • Bitcoin: A potential winner from Fed easing — liquidity tailwind + hedge against dollar weakness and persistent inflation.

What This Means for Investors

  1. Stay cautious on equities. With valuations stretched, risk-reward skews negative unless earnings keep surprising.
  2. Diversify beyond the S&P 500. Consider value stocks, defensive sectors, or international markets with lower valuations.
  3. Watch alternative assets. Gold and Bitcoin are increasingly attractive in a world of high valuations, rate cuts, and inflation risk.
  4. Keep a cash buffer. Liquidity gives you flexibility to buy during corrections.

Bottom Line

The U.S. market is entering September at its most expensive valuation in history, just as the Fed prepares to cut rates. That’s a fragile setup. Investors should brace for volatility, manage risk carefully, and keep an eye on alternative assets like gold and Bitcoin that may benefit from shifting monetary policy.

How Rate Cuts Spark Asset Booms (and Busts): Lessons from Past Fed Cycles

The Federal Reserve’s upcoming September 17 meeting has investors bracing for a rate cut. But history shows that lower rates don’t just support the economy they often fuel major market booms… and eventually, painful busts.

Let’s break down what past Fed cycles can teach us about today’s setup.


Rate Cuts = Cheap Money = Rising Assets

When the Fed cuts rates, borrowing becomes cheaper. That liquidity doesn’t just flow into businesses — it often spills into stocks, housing, and risk assets like gold and Bitcoin.

  • Lower interest costs boost corporate profits.
  • Investors chase returns as bonds yield less.
  • Speculation rises as easy money encourages risk-taking.

A Quick Look Back: Booms & Busts

  • 1990s Dot-Com Boom
    After the 1994 rate cuts, cheap capital fueled a tech bubble. The Nasdaq soared 400%… before crashing 78% by 2002.
  • 2008 Global Financial Crisis
    Years of low rates in the early 2000s helped inflate the housing bubble. When it burst, the Fed had to slash rates back to zero.
  • 2020 Pandemic Response
    Near-zero rates and stimulus checks drove massive rallies in stocks, real estate, and Bitcoin. But 2022’s inflation spike forced the Fed into its fastest hiking cycle in 40 years.

What It Means for 2025

The market today looks eerily familiar:

  • S&P 500 trading at record 3.15× sales (the highest in history).
  • Gold near all-time highs as a hedge.
  • Bitcoin primed to benefit from another round of Fed easing.

The danger? Rate cuts often work like rocket fuel at first — but they can also inflate bubbles that eventually burst.


TL;DR — Key Lessons for Investors

  • Rate cuts pump liquidity into markets, boosting stocks, housing, and crypto.
  • Every boom has a bust. The bigger the run-up, the harsher the correction.
  • 2025 looks frothy. Stocks are at record valuations, making them vulnerable.
  • Diversification matters. Don’t chase momentum blindly balance equities with gold, Bitcoin, and cash for flexibility.

Bottom Line

History shows that rate cuts spark powerful asset rallies but rarely end well if valuations are already stretched. As the Fed moves to ease on September 17, investors should prepare for both short-term upside and the risk of a longer-term bust.

How the OpenAI–Oracle Deal Made Larry Ellison the World’s Richest Man

When most people think of artificial intelligence, names like OpenAI, Nvidia, or Microsoft come to mind. But the latest AI mega deal shows that the biggest winners may be hiding in the infrastructure layer.


The $300 Billion Deal That Changed Everything

In September 2025, OpenAI signed a $300 billion, five-year cloud computing agreement with Oracle.

  • The contract is part of Project Stargate, a joint effort expected to channel as much as $500 billion into AI infrastructure by the end of the decade.
  • Oracle will provide the computing backbone that OpenAI needs to train and deploy its next generation of AI models.

This wasn’t just another contract it was a vote of confidence in Oracle as a critical AI enabler.


Oracle’s Transformation: From Database Giant to AI Backbone

For decades, Oracle was best known as a database software company. But in recent years, it’s reinvented itself as a cloud infrastructure provider.

  • Oracle’s Remaining Performance Obligations (RPO)  a measure of guaranteed future revenue — jumped to $455 billion, up more than 350% year-over-year.
  • The company now projects cloud revenue could reach $144 billion annually by 2030.

Investors quickly noticed. Oracle’s stock surged over 40% in a single day, its biggest jump since 1992.


Larry Ellison’s Record-Breaking Wealth Surge

Larry Ellison, who owns about 41% of Oracle, became the richest man in the world almost overnight.

  • His net worth soared by more than $100 billion in one day, the largest single-day gain ever recorded.
  • As of September 2025, Ellison’s fortune sits around $393 billion, surpassing Elon Musk and cementing his place at the top.

The Bigger Picture: AI’s Infrastructure Gold Rush

The OpenAI–Oracle deal highlights a key trend in the AI era:

  • Model builders (OpenAI, Anthropic, xAI) grab headlines.
  • Chipmakers (Nvidia) mint massive profits.
  • But infrastructure providers (like Oracle, Amazon AWS, and Microsoft Azure) quietly become indispensable.

In the 21st-century gold rush of AI, Oracle is selling the shovels.


TL;DR

  • OpenAI signed a $300B deal with Oracle to power AI development.
  • Oracle stock soared, adding over $100B to Larry Ellison’s wealth in one day.
  • Ellison is now the world’s richest man with ~$393B net worth.
  • The deal shows that AI’s biggest winners may be in infrastructure, not just algorithms.

Bottom Line

The OpenAI–Oracle deal is more than a contract it’s a turning point. It proves that AI infrastructure is now one of the most valuable assets in the world. For investors and entrepreneurs, the lesson is clear: in every technological revolution, the people who build the rails often reap the biggest rewards.

How Economic Data Moves Markets: Jobs Report, CPI, GDP Explained

You’ve probably seen headlines like:

📉 “Markets tumble after jobs report surprise”
📈 “Stocks rally on better-than-expected CPI numbers”

But what do those numbers really mean—and why do investors care so much?

If you’ve ever felt confused by terms like CPIGDP, or non-farm payrolls, you’re not alone. Here’s a clear, beginner-friendly breakdown of the most important economic reports and how they move the markets—and your money.


🧠 Why Economic Data Matters

Think of economic data as a report card on the health of the U.S. economy. Investors, analysts, and the Federal Reserve use these numbers to make decisions about:

  • Spending
  • Interest rates
  • Investments
  • Business strategy

When a major report is better or worse than expected, it can shift everything from stock prices to mortgage rates within hours.


📊 1. Jobs Report (Non-Farm Payrolls)

Released by: U.S. Bureau of Labor Statistics
When: First Friday of every month
What it shows:

  • How many jobs were added or lost
  • Unemployment rate
  • Wage growth

Why it moves markets:

A strong jobs report means a strong economy—but it can also signal that the Fed might raise interest rates to cool inflation.
A weak report may signal economic trouble, but it could also mean the Fed may cut rates to stimulate growth.

Example:

In 2023, a surprise surge in job creation caused the stock market to dip—because traders feared more rate hikes were coming.


💸 2. CPI (Consumer Price Index)

Released by: U.S. Bureau of Labor Statistics
When: Monthly
What it shows:

  • The rate of inflation (how fast prices are rising for goods and services)

Why it moves markets:

CPI is the #1 inflation measure the Fed watches.

  • High CPI = More rate hikes likely
  • Low CPI = Rate cuts or pause

Example:

A hotter-than-expected CPI can send stocks lower and bond yields higher, especially if inflation appears “sticky.”


📈 3. GDP (Gross Domestic Product)

Released by: U.S. Bureau of Economic Analysis
When: Quarterly
What it shows:

  • How fast the economy is growing or shrinking
  • Based on consumer spending, business investment, government spending, and trade

Why it moves markets:

GDP reveals the overall health of the economy.

  • Strong growth = good news… unless it sparks inflation
  • Weak growth = recession fears

Example:

If GDP shrinks two quarters in a row, that’s typically considered a recession—and markets react quickly.


🧮 Bonus Reports That Also Matter

  • PCE (Personal Consumption Expenditures): Another inflation gauge the Fed prefers over CPI
  • Retail Sales: Shows consumer spending strength
  • ISM Manufacturing Index: Measures business activity and sentiment
  • Consumer Confidence Index: Gauges how people feel about the economy
  • Initial Jobless Claims: Weekly check on layoffs

📉 So… Why Do Markets React So Quickly?

It’s not just the numbers—it’s what the market expected vs. what actually happened.

Markets are forward-looking. They try to price in the future. So a surprise report can change everything:

  • Bad data = Fed may cut rates = stocks go up
  • Good data = Fed may raise rates = stocks go down

It can feel backwards, but it’s about expectations, not just reality.


👁️ What to Watch (Even If You’re Not a Trader)

You don’t need to be an economist to understand how these reports affect you:

  • 📊 Investing: Economic data affects stock prices and interest rates
  • 🏡 Buying a home: Mortgage rates are influenced by inflation and jobs data
  • 💳 Using credit: Rate hikes make borrowing more expensive
  • 📉 Recession risk: GDP and job data help you prepare for downturns

🧠 Final Thought: Stay Focused, Not Shaken

Economic data is important—but you don’t have to panic at every headline. Think of it like weather forecasts:

One report doesn’t make a climate—just like one bad week doesn’t make a bad investment.

Stay calm. Stay diversified. And use economic reports to stay informed—not scared.


FutureFinanceLab.com simplifies complex financial topics so you can invest smart and build real wealth. No noise, no jargon—just what matters.

The Stock Market vs. the Economy: What’s the Difference?

“Why is the stock market soaring while people are losing jobs?”
“If we’re in a recession, why are investors making money?”

These questions come up a lot—especially during times of crisis or uncertainty. The truth is: the stock market is not the same as the economy. They’re connected, but they move at different speeds and often tell different stories.

Here’s a simple, clear explanation of how they differ—and why both matter to your money.


📈 What Is the Stock Market?

The stock market is a marketplace where people buy and sell shares of publicly traded companies like Apple, Tesla, or Amazon. It reflects:

  • Corporate earnings
  • Investor expectations
  • Future growth potential

Stock prices go up when investors believe companies will make more money in the future.


🏛️ What Is the Economy?

The economy is the big picture of how much money is being made and spent across the country. It includes:

  • Jobs and wages
  • Consumer spending
  • Business activity
  • Housing, manufacturing, services, and more

Think of it as the health of all households and businesses—not just corporations.


🎯 Key Differences

Stock MarketEconomy
MeasuresCompany performance & investor sentimentReal-world activity: jobs, spending, output
Affected byProfits, interest rates, newsEmployment, inflation, GDP
MovesFast – reacts to future expectationsSlow – based on current reality
Who it reflectsInvestors (often wealthier households)Everyone, including workers and families

💡 Why the Market Can Rise While the Economy Struggles

This happens more than you’d think.

Example: COVID-19 in 2020

  • Economy: Millions unemployed, businesses closed
  • Stock Market: Rebounded fast and hit record highs
    Why? Investors believed the worst was temporary. The Fed slashed interest rates. Stimulus checks helped. And tech companies thrived while people stayed home.

Reason 1: The Market Looks Ahead

The stock market is forward-looking. It reacts to what might happen 6–12 months from now—not what’s happening today.

Reason 2: Not All Companies Represent Everyone

Big tech companies can soar while small businesses suffer. The market reflects public companies—not the mom-and-pop stores on your street.

Reason 3: Investors Aren’t Everyone

Only around 58% of Americans own stock. And most wealth is concentrated in the top earners. So stock market gains don’t always reflect broader financial well-being.


🕵️‍♂️ Why Investors Still Watch the Economy

Even though the two aren’t identical, investors can’t ignore the economy. Here’s why:

  • Weak job numbers can lead to falling consumer spending
  • A shrinking economy (negative GDP) may hurt earnings
  • Inflation data affects interest rates, which affect stocks

The trick? Knowing that short-term disconnects are normal, but in the long run, they usually reconnect.


🧠 Bottom Line: Watch Both, Think Long-Term

If you’re an investor or just trying to understand your financial world, it helps to track both the stock market and the economy.

  • One tells you where corporate profits and investor moods are headed
  • The other tells you how real people are doing right now

The market is not the economy—but both matter.


FutureFinanceLab.com helps simplify financial concepts so you can understand how the system works—and how to make it work for you.

The Debt Ceiling Explained: Is the U.S. Going Broke?

Every few months or years, the headlines scream:
“Debt Ceiling Crisis!”
“U.S. Could Default on Its Debt!”

It sounds scary—but what does it really mean? Is the U.S. actually going broke? Will your savings or investments disappear?

Let’s break it down in clear, practical terms—no financial jargon, just what matters to you.


🧱 What Is the Debt Ceiling?

The debt ceiling is the legal limit on how much money the U.S. government can borrow to pay its bills.

Yes, you read that right—the government borrows money, just like a person or business might. When it hits the limit, it can’t borrow more unless Congress votes to raise it.

This borrowing pays for things the government has already promised to spend money on—like Social Security, military salaries, Medicare, interest on the national debt, and more.

👉 Think of it like this:
You’ve already swiped your credit card for groceries and rent. But when the bill comes, your bank says, “Sorry, we’re freezing your limit unless your family votes to raise it.”


🕰️ Why Does This Keep Coming Up?

Because the U.S. spends more than it earns through taxes. That means it must borrow to make up the difference—and that borrowing adds up over time.

When the government reaches the debt ceiling, it legally can’t borrow more—even if the bills are due. This triggers a political standoff almost every time.


⚠️ What Happens If the U.S. Hits the Debt Ceiling?

If Congress doesn’t raise the limit in time, the U.S. could technically default—which means failing to pay interest on its debt or pay other obligations.

That’s never happened before. But if it did, here’s what could happen:

  • Stock markets could panic
  • Interest rates could spike
  • The U.S. credit rating could be downgraded
  • Federal benefits (Social Security, military pay) could be delayed

It’s serious—and that’s why even though politicians fight about it, they usually find a last-minute solution.


💸 Is the U.S. Going Broke?

Not exactly.

The U.S. controls its own currency (the U.S. dollar), and it can always technically “print” more money. So it can always pay back debts in dollars.

But doing that recklessly could cause inflation or reduce trust in the dollar. So while the U.S. can’t run out of dollars, it can damage its financial reputation—which could hurt everyone.


📊 What It Means for You

If You’re an Investor:

  • Debt ceiling drama usually causes short-term volatility.
  • Stocks may drop during the debate—but recover fast after a deal is reached.
  • Bonds may fluctuate, especially U.S. Treasuries.

If You Have a Loan or Plan to Get One:

  • Interest rates may rise if markets lose confidence in U.S. debt.
  • That means higher mortgage, credit card, or car loan costs.

If You Rely on Government Benefits:

  • In an actual default (unlikely), checks could be delayed.
  • This includes Social Security, Medicare reimbursements, and federal salaries.

🔎 Real-Life Example: 2011 Debt Ceiling Crisis

In 2011, Congress nearly failed to raise the ceiling in time.

  • The U.S. credit rating was downgraded for the first time in history.
  • The stock market dropped sharply (S&P 500 fell nearly 17% in weeks).
  • Interest rates spiked temporarily—affecting mortgage and loan costs.

But after a deal was reached, the markets recovered. The scare was real—but it didn’t last.


✅ The Takeaway

The debt ceiling debate is more political than practical—but it has real consequences if it drags on.

You don’t need to panic, but you should pay attention. Here’s what to do:

💡 What You Can Do:

  1. Stay invested long-term—don’t react emotionally to political drama.
  2. Keep an emergency fund in case federal payments are delayed.
  3. Watch interest rate trends if you’re shopping for a mortgage or car loan.
  4. Understand the headlines—but don’t let fear drive your financial choices.

🧠 Final Thought

The U.S. isn’t broke—but political gridlock can cause real ripple effects across the economy. The more you understand how the system works, the better decisions you can make with your money.

At FutureFinanceLab.com, we simplify what really matters—so you can invest smart, spend wisely, and plan with confidence.

What Is the Stock Market? A Beginner’s Guide in Plain English

Introduction

Ever heard people talk about “the market” and wondered what the fuss is about? Whether it’s stocks going up, crashing down, or breaking records, the stock market can sound like a mysterious world for insiders only. But it doesn’t have to be. In this guide, we’ll break it down in plain English so anyone—yes, even you—can understand it.


🧠 What Is the Stock Market?

The stock market is a place where people buy and sell pieces of companies, called stocks or shares.
When you buy a stock, you own a small piece of that company.

There are two major parts:

  • Stock exchanges – like the New York Stock Exchange (NYSE) or Nasdaq.
  • Investors – people like you and me (plus big institutions) trading these stocks.

💡 Why Do Companies Sell Stocks?

When companies need money to grow, they can:

  • Take loans
  • OR sell part of their company to investors by going public

Going public = listed on the stock market.

In return, investors hope the company grows and their stock price goes up, so they can sell it for more later.


📊 How Do You Make Money in the Stock Market?

There are two main ways:

  1. Capital Gains – Buy low, sell high.
  2. Dividends – Some companies pay you part of their profits regularly.

🚪 How Do You Start Investing?

  1. Open a brokerage account (like Fidelity, Schwab, or Robinhood).
  2. Fund it with your money.
  3. Choose what to buy – individual stocks, ETFs, or index funds.
  4. Hit “buy” – you’re officially an investor!

👉 Tip: Start small and think long-term.


⚠️ What Are the Risks?

  • Stocks can go up and down.
  • You could lose money in the short term.
  • But history shows the market grows over time.

That’s why long-term investing is key.


🧰 Final Thoughts

You don’t need to be a Wall Street expert to start investing.
You just need to understand the basics, stay curious, and take the first step.

What Do Fed Meetings Really Mean for You?

Behind the Headlines of Rate Hikes and Cuts

Every few months, the news lights up with headlines like:
“Fed Hikes Interest Rates by 0.25%” or “Fed Signals Pause in Rate Cuts.”
But what does that actually mean—for your wallet, your investments, or your plans to buy a house or car?

Let’s break it all down in simple language, with real-life examples.

What Is the Fed?


🔍 First Things First: What Is the Fed?

The Federal Reserve (aka “the Fed”) is the central bank of the United States. Its job is to keep inflation under control, support employment, and maintain a stable financial system. One of its most powerful tools? Interest rates.

The Fed sets something called the federal funds rate—which is the interest rate banks charge each other to borrow money overnight. This rate trickles down and affects everything from your credit card interest to mortgage rates to stock prices.


📈 When the Fed Raises Rates (Rate Hike)

When the Fed raises rates, borrowing becomes more expensive.

  • Credit cards cost more.
  • Car loans and mortgages get pricier.
  • Business loans are harder to get.

Why do they do this? Usually to cool down inflation. If prices are rising too fast (like gas, groceries, rent), higher rates slow things down. Less borrowing = less spending = lower inflation.

💡 What It Means for You:

  • Stock Market: Stocks often go down short-term. Higher rates mean companies borrow less, spend less, and might grow more slowly.
  • Planning to Buy a House or Car? Loans get more expensive. Your monthly payment goes up.
  • Have Credit Card Debt? You’ll likely pay more in interest.
  • Savings Account? Good news—banks might offer higher returns on your savings.

📉 When the Fed Lowers Rates (Rate Cut)

When the Fed cuts rates, it’s trying to stimulate the economy.

  • Borrowing becomes cheaper.
  • People and businesses are encouraged to spend more.
  • The goal? To boost growth—especially during slowdowns or recessions.

💡 What It Means for You:

  • Stock Market: Stocks usually go up. Cheap money often leads to higher profits and more investment.
  • Planning to Buy a House or Car? Lower interest rates mean smaller monthly payments.
  • Have Credit Card Debt? You might pay less in interest—but not by much. Credit card rates don’t fall as fast.
  • Savings Account? Your bank might lower your interest rate.

🏦 Real-Life Example:

Imagine You’re Buying a House

  • With high interest rates (7% mortgage): A $400,000 loan = ~$2,660/month
  • With low interest rates (4% mortgage): That same loan = ~$1,910/month

That’s $750 more every month, just because of interest rates!


📊 What About Investors?

If you’re investing in the stock market—or thinking about it—Fed decisions are like ripples in a pond.

  • Tech and growth stocks get hit harder when rates rise, because future profits are worth less today.
  • Banks and value stocks often benefit when rates rise, due to better loan margins.
  • Real estate stocks (REITs) may suffer when borrowing is more expensive.

Long-term investors don’t need to panic every time the Fed moves. But it helps to understand how policy shapes the financial climate.


🧠 The Takeaway: Think Like a Financial Weather Forecaster

  • Rate Hikes = Cooling Down (slow the economy)
  • Rate Cuts = Heating Up (stimulate growth)

These are not just Wall Street terms—they affect your mortgage, your credit card, your investments, and even your job prospects.


✅ Actionable Tips for You

  1. Buying a home soon? Shop for the best rate—but know it could rise after a Fed meeting.
  2. Investing? Don’t chase short-term moves. Think long-term, but stay informed.
  3. Carrying debt? Consider paying off high-interest credit cards before rates rise again.
  4. Savings? Compare interest rates on high-yield accounts when rates are rising.

Final Thoughts: Why It Matters

Fed decisions may sound like boring economic news, but they’re actually power moves that shape your financial life. The more you understand what’s going on behind the headlines, the more confidently you can make smart money moves.

Next time you hear, “The Fed just raised rates,” don’t just scroll past it—know exactly what it means for you.


📚 Want to Learn More?

Check out our beginner-friendly articles and video explainers at FutureFinanceLab.com. We’re breaking down finance, one simple concept at a time.

ETFs Explained Like You’re 5 – What’s a Fruit Basket Got to Do with Investing?

Feeling overwhelmed by investing? Don’t worry—ETFs might be the simplest (and smartest) place to start. And yes, we’re explaining them like you’re five… with fruit. 🍎🍌🍇


🍏 If Stocks Are Fruits…

Imagine each stock is a piece of fruit. Apple might be, well… an apple. Netflix? A banana. Buying one fruit is like investing in one company. But if that fruit goes bad—you’re stuck.


🧺 ETFs Are the Fruit Basket

ETFs (Exchange-Traded Funds) are like a basket that holds many fruits at once. So instead of betting everything on one apple, you get a little bit of apple, banana, grapes—maybe even a pineapple.

That means:

  • ✅ Less risk through diversification
  • ✅ Easy access to entire markets or industries
  • ✅ Lower fees than traditional mutual funds
  • ✅ Perfect for beginners and long-term investors alike

💡 Why Smart Investors Choose Baskets

When you invest in an ETF, you’re not trying to guess which single stock will win—you’re building a safer, smarter strategy.


🚀 Ready to Start Investing?

Join FutureFinanceLab.com – where beginners become strategists.
Learn the basics. Explore the tools. Build your future.

Because smart investing isn’t about picking one fruit—it’s about picking the right basket. 🍇📈

Does “Buy the Dip” Actually Work? A Look at Historical Market Crashes

“Buy the dip” is one of the most repeated mantras in investing—but does it really work? Should you be buying when markets are falling and headlines are screaming panic?

Let’s cut through the noise and look at how buying the dip has performed during some of the most significant market crashes in history.

What Does “Buying the Dip” Mean?

Buying the dip refers to purchasing stocks or assets after a significant decline in price, with the expectation that they’ll rebound. The idea is simple: buy low, hold, and wait for the market to recover.

But while the concept sounds easy, in practice, it’s psychologically tough. You’re buying when everyone else is running for the exits. So, does it pay off?

Major Market Crashes and the Dip-Buying Payoff

1. The Great Depression (1929–1932)

  • Crash: Market fell ~86% from peak to trough.
  • Recovery Time: 25 years (S&P didn’t return to 1929 levels until 1954).
  • Buy the Dip Outcome: Those who bought in 1932 saw several hundred percent gains over the following decades—but it was a long and bumpy road.

2. Black Monday (1987)

  • Crash: -34% in one day.
  • Recovery Time: Less than 2 years.
  • Buy the Dip Outcome: Investors who bought after the crash nearly doubled their money within a few years.

3. Dot-Com Crash (2000–2002)

  • Crash: S&P fell ~49%.
  • Recovery Time: 7 years (recovered by 2007).
  • Buy the Dip Outcome: Buying in 2002–2003 gave you a ~100% return by 2007. Tech-heavy Nasdaq took longer to fully recover, but gains were significant for patient investors.

4. Global Financial Crisis (2008)

  • Crash: -57% decline in the S&P 500.
  • Recovery Time: About 6 years.
  • Buy the Dip Outcome: If you bought in early 2009, you saw returns of over 400% by 2020.

5. COVID-19 Crash (2020)

  • Crash: -34% in about a month.
  • Recovery Time: Just 6 months.
  • Buy the Dip Outcome: Those who bought in March 2020 saw their portfolios double within 18 months.

The Takeaway: Buying the Dip Works—If You’re Prepared

Historically, buying the dip has delivered strong long-term returns, but it requires:

  • Liquidity: You need cash on hand when the market drops.
  • Conviction: It’s hard to buy when fear is at its peak.
  • Time Horizon: The biggest gains come from holding for years, not weeks.

Important note: Not all dips are created equal. Some recoveries take years. Timing the exact bottom is nearly impossible, which is why averaging in over time (dollar-cost averaging) is often more effective than trying to “call the bottom.”

Final Thoughts

Buying the dip isn’t a get-rich-quick scheme—it’s a mindset rooted in long-term belief in markets. While the past doesn’t guarantee future results, history consistently rewards investors who stay calm during chaos and stick to their strategy.

In times of panic, opportunity often hides in plain sight.